
As an industry leader, you’re likely aware of the many high-level reports that regularly come out from influential industry and governing bodies that provide insight on the state of the construction industry and where it’s headed. This includes reports from The Associated Builders & Contractors (AGC), AIA, and Dodge Data and Analytics, which regularly publish indicators about construction spending, backlog rates, and a confidence index, as well as from the U.S. Census Bureau and the U.S. Bureau of Labor Statistics, which tracks labor and the rate of employment.
For example, in this blog up on Viewpoint’s website, a Trimble company and construction ERP leader, the Q1 Commercial Construction Index report released by the U.S. Chamber of Commerce in March notes that contractor confidence appears to be on the rise. It found that 87 percent of contractors surveyed expected their 2021 revenues to either remain unchanged or increase, while 86 percent voiced confidence in the U.S. markets’ ability to provide continued work over the next 12 months. Additionally, 46 percent have plans to hire more workers. Of course, some of this ties to the Biden Administration’s proposed infrastructure spending package.
While these reports are insightful, until recently, there were very few customer-driven reports stemming from private companies, which can be helpful since they’re based on personally inputted data. That’s changing thanks to Viewpoint, which just released its first Quarterly Construction Metrics Index. The Index, which explores trends related to job creation, project stats, and contract values, uses real-time, anonymized data from 1,000 Viewpoint clients which collectively managed over $76 billion worth of construction projects in 2020. Examined from the fourth quarter of 2020 and year-over-year, the metrics are designed to provide early directional information to help industry leaders understand the construction landscape and assess how their own companies are tracking against averages.
Here are some of the highlights from the index:
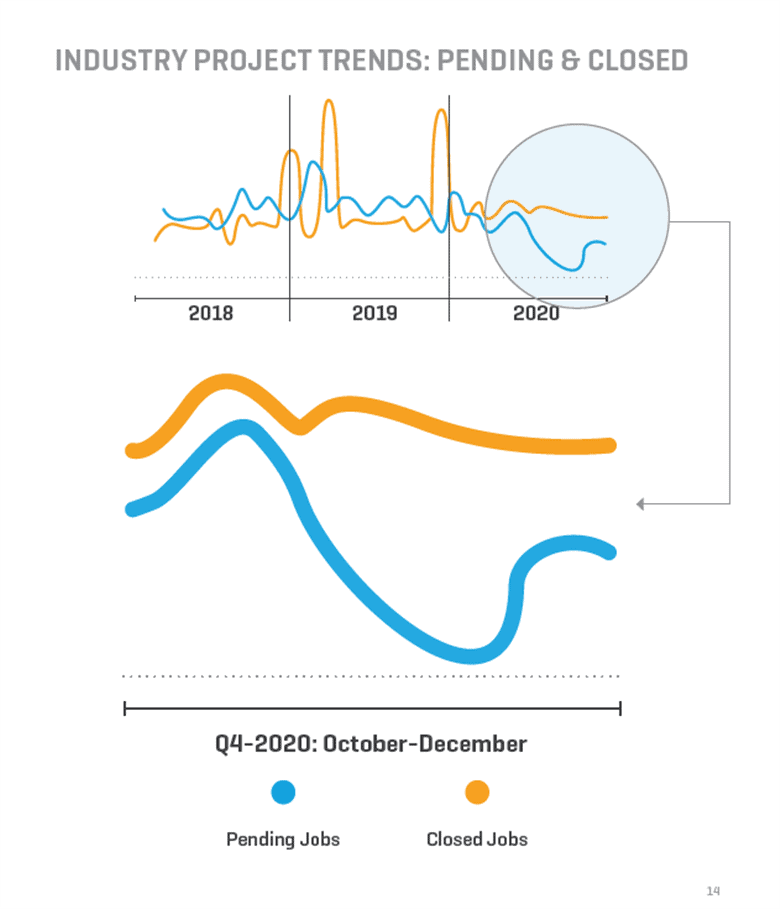
Delayed and Cancelled Projects Became the Norm
Spring and summer are typically the busiest time for the construction industry, but pending projects, which is when a project is logged in the system but not yet completed, stayed well below average over the spring and summer months last year. An uncertain and challenging business environment led to contractors holding back on starting new projects, with many being delayed and/or canceled.
Pending projects continued to decline in the fall and winter, ending 2020 with a year-over-year decline of 30 percent. While this looks dire, it’s worth noting that 2019 was a banner year for the industry, with overall projects down five percent as compared to 2019, which saw a 116 percent increase in projects as compared to 2018.
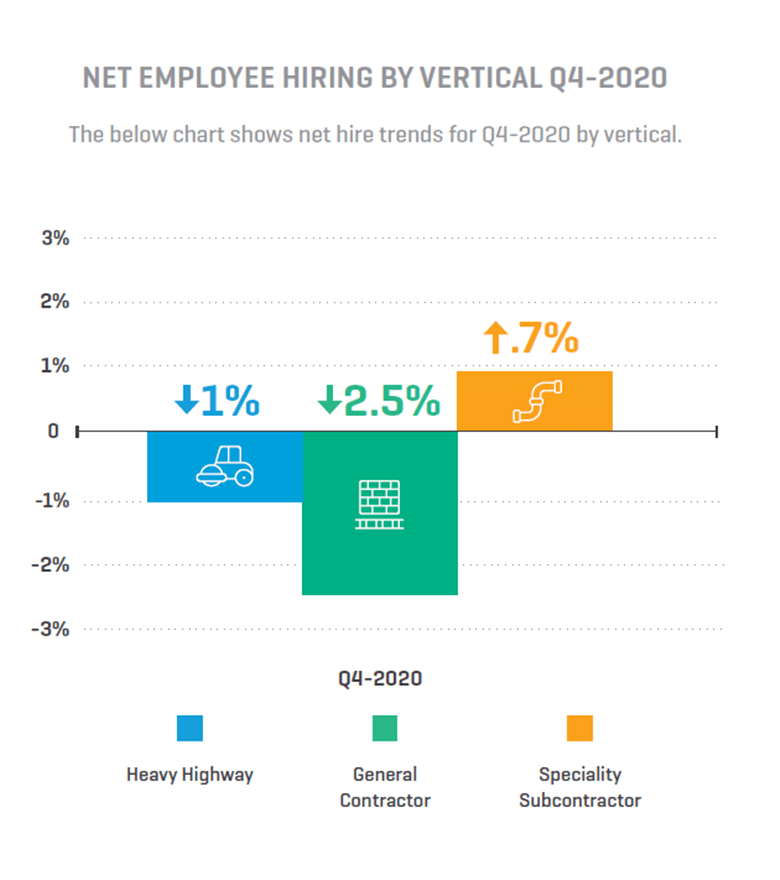
A Drop in Hiring Followed by a Decline in Projects
When projects are delayed or canceled, it naturally impacts hiring as projects spur employment. By the end of 2020, hiring was officially down 30 percent year-over-year, which hit heavy-highway and general contractors the most throughout the year. Interestingly, specialty contractors maintained positive net employment, which could be attributed to their ability to do projects backlogged by general contractors and/or routine service/maintenance work. While the numbers look severe, 2019 saw a 13 percent increase in hiring as compared to 2018, reflecting that the year was exceptionally strong for the industry.
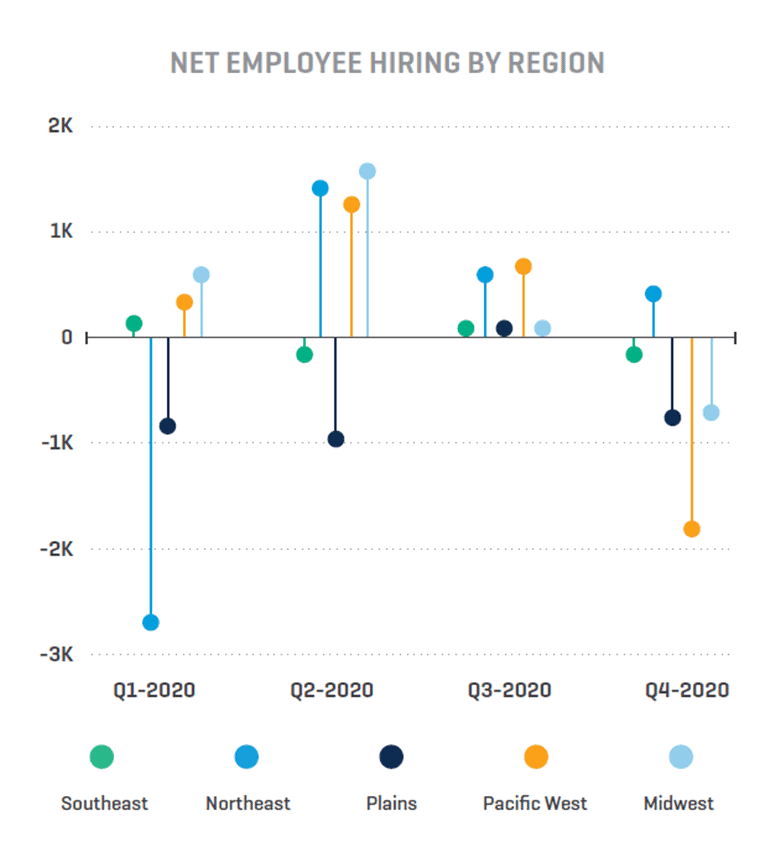
Geography Greatly Influenced Hiring
While aggregated net hiring was down for every region in 2020, there were bright spots along the way, which varied depending on when the pandemic surged across the United States. For example, the Northeast experienced a sharp decline in March but then rebounded throughout the rest of the year. As the Northeast recovered, most of the rest of the country experienced negative hiring growth as the pandemic caused business instability, particularly in the Plains, Midwest, and Southeast regions.
Contract Values Also Declined
Not surprisingly, contract values were also down by 25 percent year-over-year, which was seen across all three verticals. General contractors experienced the sharpest decline of 36 percent year-over-year, followed by heavy highway with a decline of 30 percent year-over-year, and specialty contractors who were down 18 percent year-over-year. This is congruent with the vertical stats mentioned earlier, which negatively impacted heavy highway and general contractors more so than specialty contractors who tend to be more flexible and can take on smaller jobs and/or routine service work.
What Does the Future Hold?
The good news is that there is a lot of hope that 2021 will generate far better numbers for the industry, particularly as the Biden administration puts a renewed focus on the importance of infrastructure in driving employment and economic progress, and vaccines continue to be rolled out.
Viewpoint will be closely monitoring the industry’s project, hiring, and contract value trends and providing updates every quarter to help industry leaders stay in touch with the construction landscape so that they can respond and scale their own businesses accordingly. To receive the next Quarterly Construction Metrics Index, sign up here.
![]()

Anne Hunt is the director of data and analytics for Viewpoint, a Trimble company that delivers leading-edge construction management software. She leads the incubation and innovation of new data first services to revolutionize how clients and the construction industry at large operates.