The Benefits of Modeling and Optimizing Production Systems: An Application on Civil Infrastructure Projects
By Garrett Bryan, Strategic Project Solutions Inc.; Chet Carlson, Strategic Project Solutions Inc.; Stanislav Gaponenko, McKinsey & Company; and Shubhraneel Mitra, McKinsey & Company
Civil infrastructure projects such as roads, bridges, ports, tunnels, and airports are critical endeavors for the growth and modernization of societies. Their public nature creates a unique level of exposure and scrutiny where project performance is in the eye of society. But unfortunately, the delivery of civil infrastructure projects suffers from less-than-optimal performance with abundant and striking evidence of schedule and cost overruns, while health, safety, environmental, and quality standards are being compromised.

Many are attempting to address the criticality and complexity of civil infrastructure projects through the same conventional means that create the current situation, so performance issues not only remain active but are amplified. To achieve radically better project performance, including the reduction of the carbon footprint associated with project delivery, this article describes the application of Project Production Management (PPM) to identify and mitigate production-based risks and opportunities that are typically hidden through the lens of conventional project management practices.
More specifically, this paper describes how project teams have unlocked value in the way of 20% schedule acceleration up to 300% improvement in cycle times, which represents 100% improvement from classic lean applications. This is achieved by adopting a project production perspective, including the use of digital technologies to map, model, simulate, analyze, and optimize project production systems, application of the Five Levers of Production System Optimization, and Operations Science.
INTRODUCTION
Less-than-optimal delivery of capital projects has become a normalized pain across the global engineering and construction industry. There exists a strong emphasis on project administration, including, but not limited to, setting and managing contracts as well as a fascination with monitoring and accurately forecasting project progress and pending completion. This applies to projects from simple to complex, non-critical to critical, small to large, and occurs across all project types, including civil infrastructure. However, the ongoing attempt to use project administration approaches to manage project production results in the illusion of being in control until it is too late.
This article brings successful stories of the application of Project Production Management methods to the delivery of civil infrastructure projects, resulting in the ability to compress schedules by 20% and improve cycle times by up to 300% without compromising safety, environmental, and quality standards.
The specific application of PPM described herein is modeling and optimizing project production systems using digital technologies. This includes understanding how the production systems behave based on current decisions teams have made for their configuration, as well as identifying areas of opportunity so the production systems are able to meet demand while doing more with less.
The project production systems analyzed and optimized as part of these efforts include an initial application on a section of a public road in construction (elevated platform) and a subsequent application that looked at the construction of new harbor infrastructure, both projects executed by the same construction company.
METHODOLOGY
One of the first steps in understanding the methodology used for these applications is to differentiate schedules from project production systems,1 as they are not the same. From a production perspective, schedules set the demand the production system should respond to. If the capacity2 of the production system is less than its demand,2 the project will experience delays. If the capacity of the production system is greater than its demand, there may be an opportunity to accelerate or meet the desired demand with fewer resources.
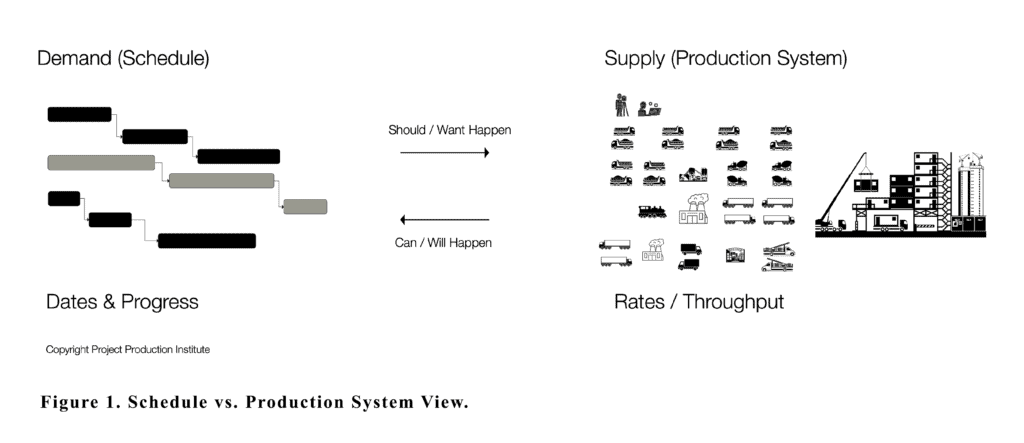
The proposed methodology uses schedules to determine the demand (number of units over time), but it does not perform conventional analyses of schedules such as P50/P90 analysis and establishing critical paths. Instead, this approach captures the current design of the production system and its capacity by creating a production process map that accounts for operations, stacks, queues, and how units of production flow.
Operations are the actions that transform one or more attributes of an entity or set of entities using one or more resources to perform the transformation. Stocks represent material or informational inputs to a production process as well as the finished goods leaving that process. Stocks should be sized appropriately to meet the system’s needs, but no larger. Stocks too large require additional infrastructure to manage and preserve items in the stock and create the risk of obsolescence, especially for engineered-to-order components. Queues expose work waiting for capacity. Larger queues lead to longer cycle times.
The methodology incorporates specific production data as parameters to production process maps to create a digital representation of the production system (can include knowledge and craft work). Such a model provides project teams with a clear understanding of production system behavior. Production data includes process and setup times and resource allocation for each operation, batching policies, variability in demand and production, and capacity contributors, to name a few.
This enables conducting both Analytical Modeling and Discrete-event Simulation (DES) on the production system. Analytical modeling uses a mathematical model to determine optimal work-in-process levels that deliver maximum throughput with minimum cycle times. DES provides additional flexibility to modeling specific production rules and gives project teams a detailed picture of how the production system changes over time.
Next, the section outlines case applications of this methodology, including impact, process, and outputs.
CASE APPLICATIONS
This section summarizes the results and specific methods to model, analyze, and optimize the production systems of two civil infrastructure projects executed by the same construction company:
- The construction of a public road – elevated platform – focusing on a section that required piling to support the structure and
- The construction of new harbor infrastructure combined works on land and sea. The stories presented here are interconnected as the application of PPM on the harbor project was initiated based on the opportunities and insights that were exposed during the analysis of the road production system.
Case I: Road Construction – Elevated Platform
This project consisted of building a public road with various design requirements to address unique ground conditions. Given its complexity, the project team selected a specific section that crossed a river to explore how the organization could benefit from adopting a production system perspective to improve performance and, in so doing, augment other existing practices such as an emphasis on productivity and the application of the Last Planner System® of Production Control.
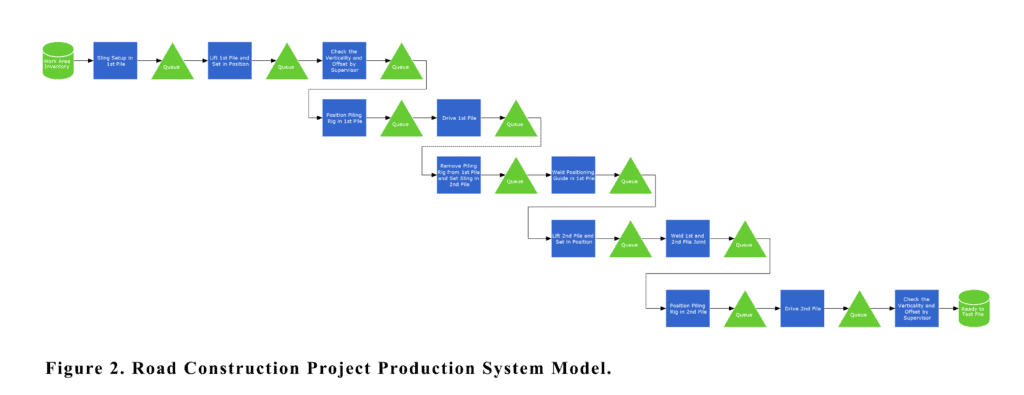
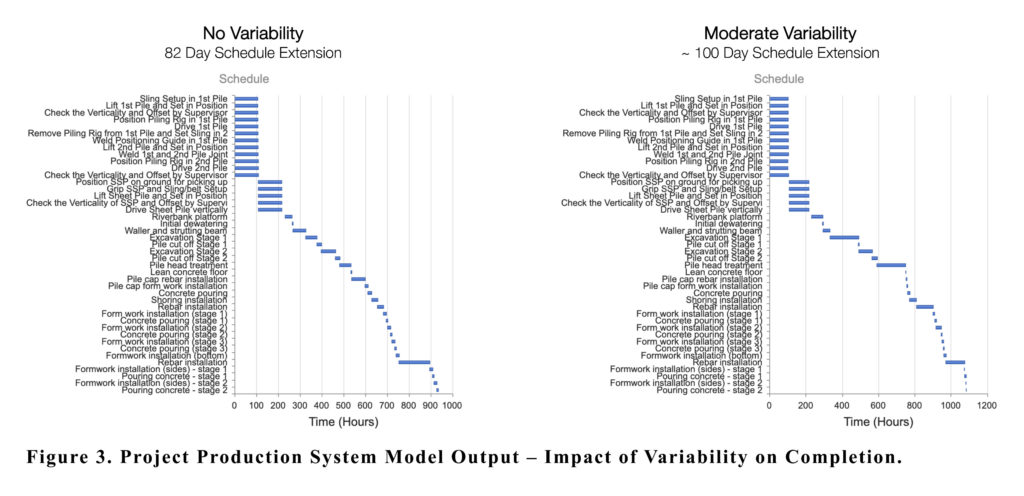
As this was the first application of production system modeling and analysis for the project team, one of the goals was to ask a basic but important question: can the selected scope be completed on time? If not, how bad is the situation? Modeling the production system exposed that the completion of the scope would be extended between 82 to 100 days, depending on the level of variability.
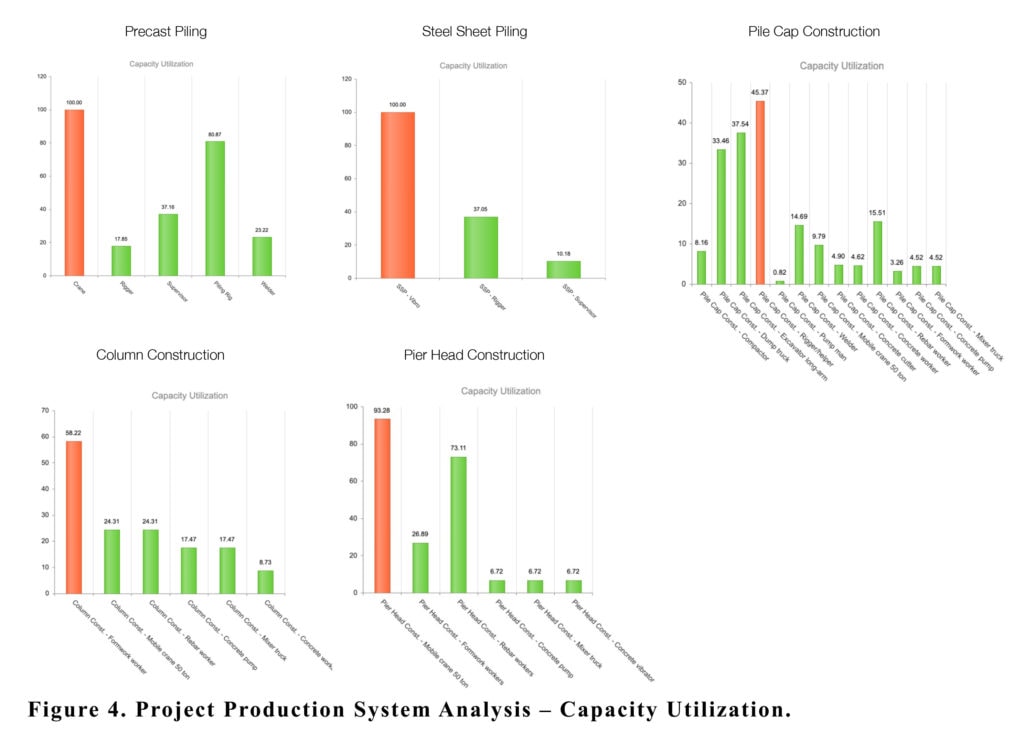
The production system included several sub-production systems, each with multiple operations. A capacity utilization2 analysis was performed to identify the bottlenecks and their impact on the project. Refer to the following capacity utilization charts in Figure 4 as well as the impact analysis table in Figure 5 for illustration purposes.
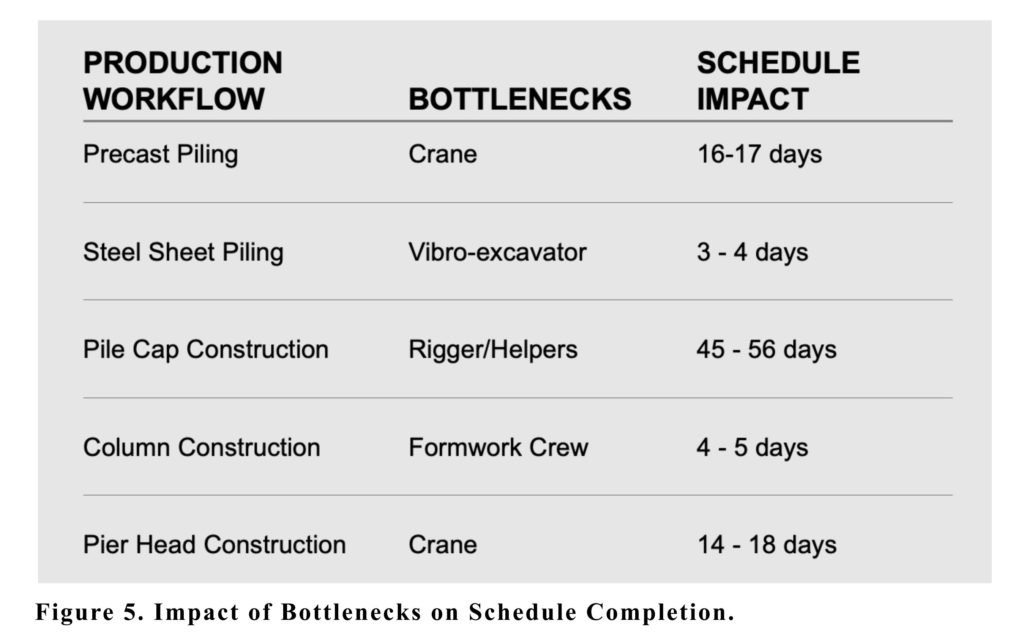
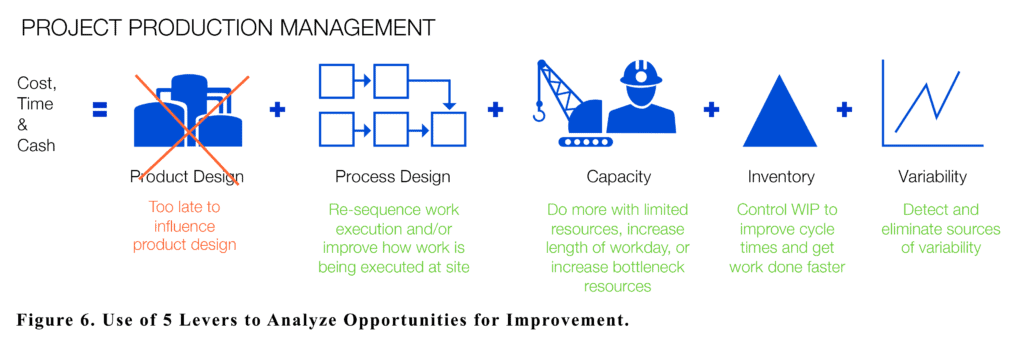
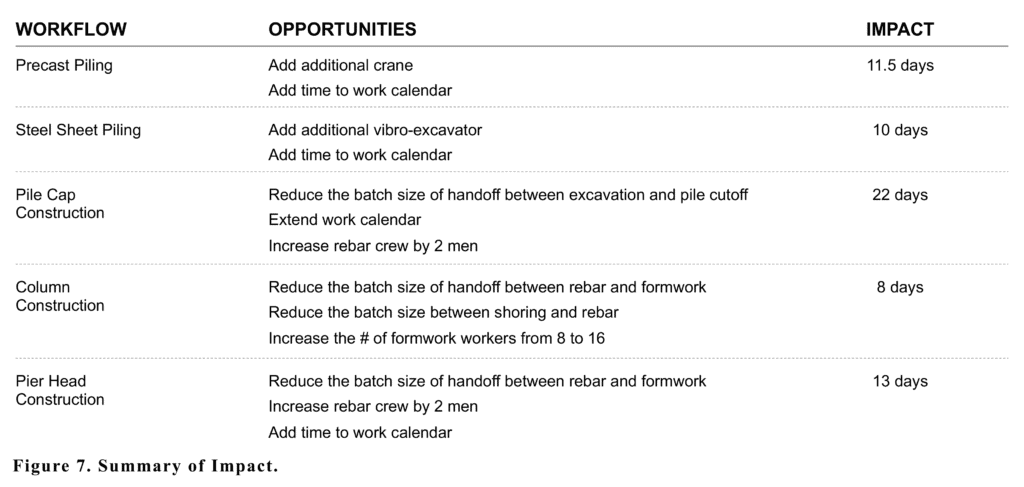
The 5 Levers of Production System Optimization were used to frame the options available that the project team had to address the delays listed in Figure 5. At the time PPM was applied, the project team had already started construction; therefore, it was too late to influence product design. However, process design, capacity, inventory, and variability remained active levers that the project team could use to improve project performance. The application of the production system model identified several opportunities, illustrated in the table below, to reduce the schedule delay in the order of 65 days.
Case II: Harbor Construction
In June 2021, construction began on a jetty with the capacity to moor large ships and sea-faring vessels. Initial estimates targeted completion by November 2022, which aligned with an upcoming global political event, and the project was endorsed by the local government as a crucial achievement for the country. Because of its public nature, completing the project on time was vital to all parties involved.
As construction was being conducted, project controls indicators detected that the on-time completion of targets was at risk. In response, the team increased manpower and equipment, recalculated labor curves, and even explored modularization for some elements of the construction process as the means to compress schedule.
Unfortunately, performance indicators continued to trend downward as work progressed. Further analysis by the project team revealed a five-month delay in the schedule, in the best possible outcome. This meant failure to meet project goals and public expectations and the subsequent impact to the brand of those involved in the delivery of the project – this was simply not an option for project leadership.
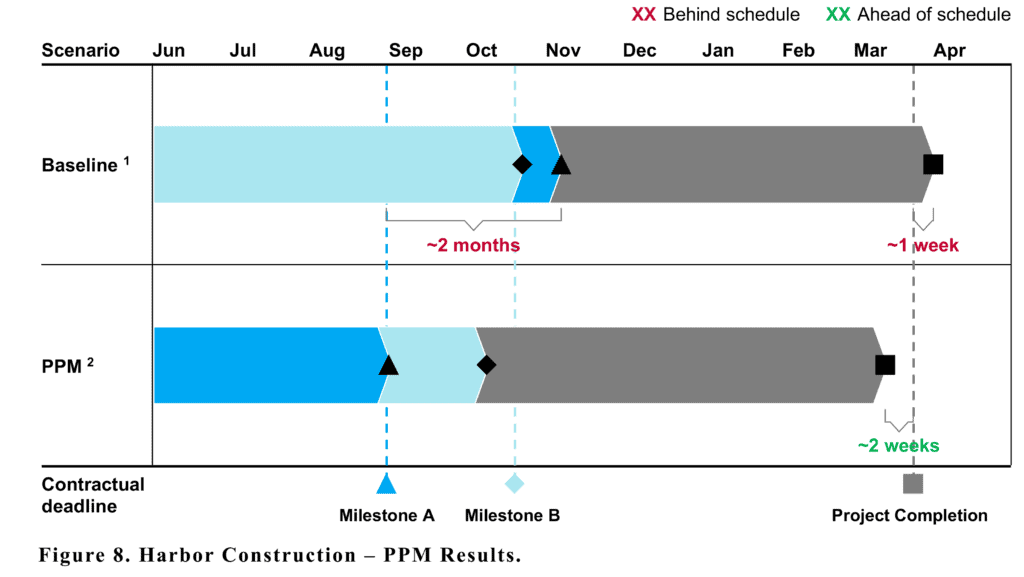
Having tried the above strategies with no improvement and having learned more about Project Production Management during the road construction project, project leadership decided to expand its application to this project. This would enable the ability to map, model, simulate, analyze, and optimize the project production systems through the lens of Operations Science and applying DES. Efforts to optimize the project production systems started in May 2022 and rapidly exposed opportunities to compress a key project milestone by two months and complete the project two weeks ahead of schedule, as depicted in Figure 8.
How was this even possible? What exactly did the team do to achieve these results? Despite the obvious fact that schedule compression was needed, detailed requirements for the analysis were defined to ensure production system modeling addresses the situation. This effort focused on answering three questions set by project leadership:
- Can the project be completed on time at the current trajectory?
- If not, what will it take to meet the target completion date?
- What is the best possible outcome for the project in terms of time and cost?
The project included land-side and sea-side construction, which both presented unique challenges. Operations, like the periodic dredging of the channel, prevented work on the sea-side work front, and the tide levels throughout a workday had to be accounted for in the model. Difficult site logistics placed budgetary constraints on the use of the equipment needed to drive piles and move materials on site, which meant efficient use of the available capacity was crucial to maintaining budget.
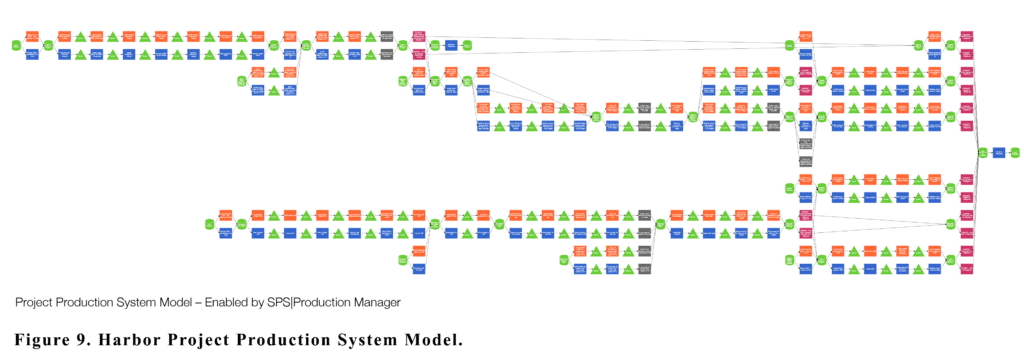
The model illustrated in Figure 9 was created to analyze and optimize this production system. This model captured process times, variability, batching policies, capacity contributors, and the impact of onsite assembly and offsite testing. The model was then validated by the project team to ensure accuracy and reliability.
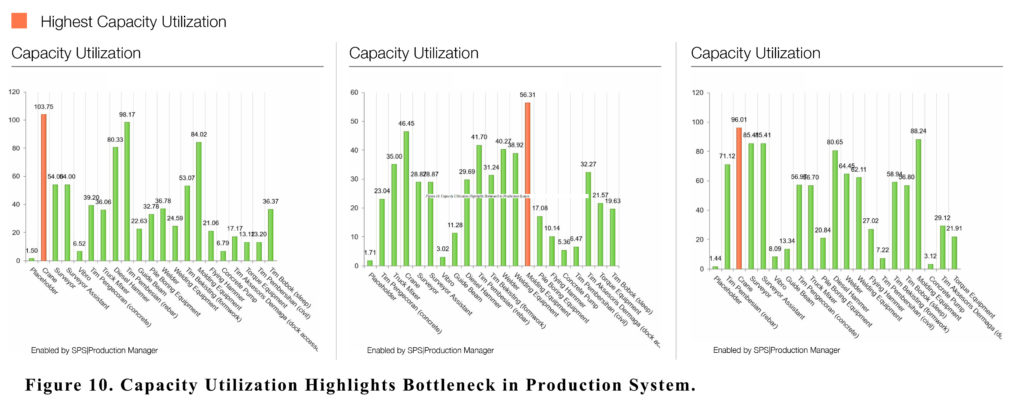
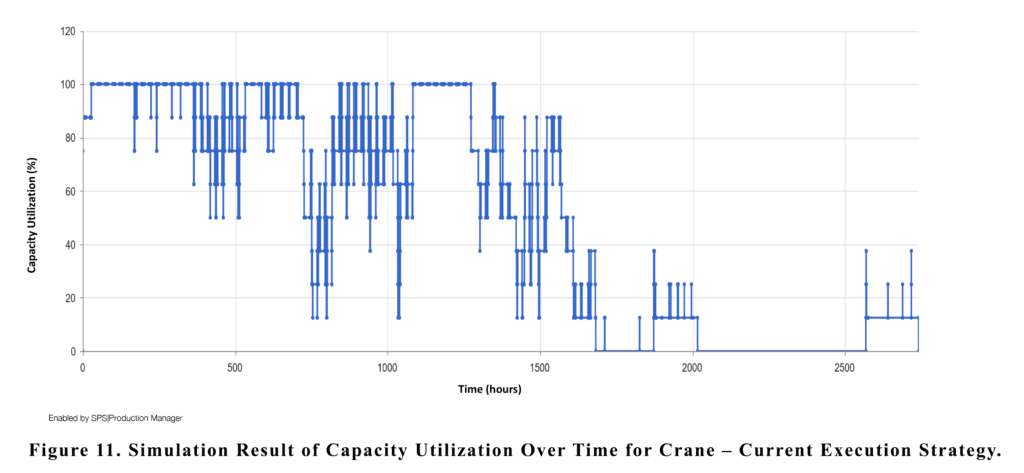
The model revealed why the project could not be completed on time using the current execution strategy. More specifically, production could not move faster for two reasons:
- Cranes and temporary installation resources, such as formwork, had an average capacity utilization exceeding 100%, i.e., demand exceeding capacity, which is impossible in a real-world scenario (Figures 10 and 11); and
- Low throughput at critical operations that released subsequent work. Coupled with no policy to control work-in-process, this created an accumulation of inventory (work-in-process and stocks) across the production system, contributing to longer project cycle times. In addition to constraining the ability to move faster, these factors also led to the under-utilization of certain resources (e.g., people standing around and equipment sitting idle – capacity contributors waiting for work).
Another way to understand why this behavior occurred is through the lens of traditional construction management. For example, when a project experiences setbacks that can be attributed to over-used labor or equipment, the decision to acquire more equipment or “ramp up” the labor force is set in motion, with little investigation for how this will impact the work that follows.
The root cause for these decisions is primarily financial, but history tells us that these actions lead to a worse outcome for the overall project. The harbor construction project was no exception. This analysis proved why the decisions made could not recover the schedule because new bottlenecks were created further in the production system and worsened the outcome of the project. Fortunately, the application of PPM to model and optimize a project production system enables a holistic and comprehensive perspective for making decisions that affect the project. This results in predicting the outcome before making any actions that would otherwise have undesirable consequences.
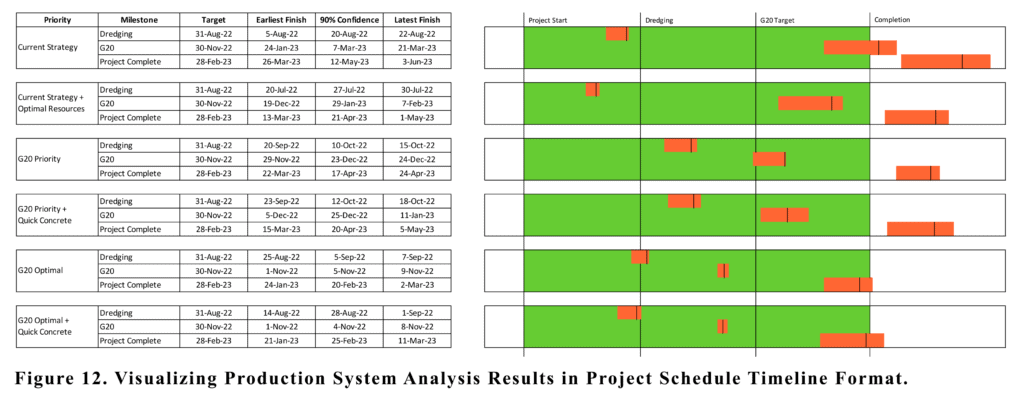
The production system model revealed that the project’s schedule could be pulled in by three months by focusing on a strategy that defines how to move and use inventory and capacity differently. If this strategy is not followed during construction, further delays are almost guaranteed. Furthermore, it tells us what the optimal resource allocation is over time, allowing, for instance, to determine when to mobilize and demobilize resources (e.g., people and equipment) with much better precision than what is generally the industry norm.
In some cases, modeling the production system may expose the need to add resources as a means to increase system capacity due to bottlenecks. Although the implementation of recommendations like these may require additional investment, this produces net positive benefits, nevertheless, due to avoidance of delays and associated costs and/or penalties.
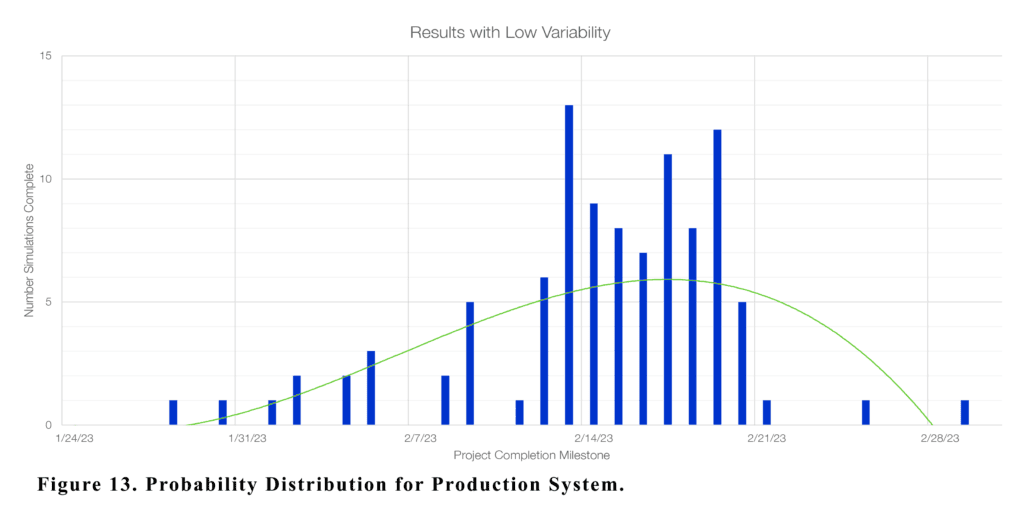
When using DES, it is important to note that running a production system simulation one time can provide a result; running it multiple times can provide a probability, but running a simulation multiple times for each possible configuration will yield the best possible outcome and its likelihood to be achieved. This determined how to achieve an optimal outcome for time and cost.
The finished model can be used to analyze the controlled parameters to reveal the optimal configuration that achieves the best outcome for project goals. With the final analysis in hand, the project was given the answers that were needed. Construction could finish ahead of schedule; the budget would not increase, and, with an acceptable level of probability, project leadership knew exactly which execution strategy would make this result a reality.
The nature of construction projects, like the harbor example, is extremely complex, and variability (known or unknown) affects all factors and performance. Statistically, conventional strategies to improve performance rarely result in improvement, and it is almost impossible to know how a decision will affect the outcome of a project because there are so many moving parts. The larger the project, the more opportunity for a single action to negatively impact performance down the road.
However, viewing a project as a production system opens a whole new perspective, including understanding and modeling real complexity in a well-defined system, one that can be configured to achieve a desired goal, and one that ensures throughput meets demand. Modeling and analyzing the design of production systems and the decisions related to their design based on the approach outlined herein enables the prediction of outputs with up to 100% probable outcome.
One step further, the analysis can be tailored for all possible configurations, yielding the most efficient outcome for any desired variable. To be precise, for every variable that can be changed in a production system, a permutation of every combination must yield results. In the case of the harbor construction project, the model contained five controllable resources with 270 configurations, two controllable processes with four configurations, and three configurations for sources of demand. This means there are 270 x 4 x 3 = 3,240 possible combinations on this production system, each with their own impact, either positive or negative, to the outcome of the project.
To determine which configuration is optimal, all must be simulated. To get a reliable probability, each configuration must be simulated multiple times. The more an instance is simulated, the higher the fidelity of the distribution and the more reliable the resulting probability. This resulted in a total of 32,580 individual simulations that were performed for the harbor construction project and proved the optimal configuration can realistically achieve the project goals.
While discrete-event simulation and analytical modeling are powerful tools, the fact that the entire analysis on the harbor construction project was performed in 32 days, from start to finish, including multiple iterations, proved to the project team that recovery is possible when effective measures are taken using a holistic approach, an approach that PPM provided. Furthermore, this analysis was performed remotely with no disruption to site construction operations – this is a value that cannot be overstated.
CONCLUSION
The application of PPM to model and optimize production systems using digital technologies has exposed opportunities to compress schedules by 20% and reduce cycle times by 300% for the projects described in this paper. It starts with a clear understanding of the underlying production system that has been configured to deliver a project. From there, the appropriate levers can be pulled to make the biggest impact on project schedule and cost. This is evidence of this methodology’s effectiveness in rapidly identify and addressing performance pitfalls to meet or exceed project objectives.
REFERENCES
Arbulu, Roberto J., Are Schedules and Production Systems the Same? Project Production Institute, 2022. [Online]. Available: https://projectproduction.org/ppi-thinking/are-schedules-and-project-production-systems-the-same.
Project Production Institute Glossary. Available: https://projectproduction.org/resources/glossary/.